(UPDATED) COVID-19 Bird Strike Update #1
As an exercise in actively tracking the impact of COVID-19 on airline traffic and bird strikes, here is an updated update #1 on the first 5 months of the year including the first two months of the US shutdown. I have had to update this post because I have learned that it takes a bit of time for the FAA Wildlife Strike Database to be updated with the strikes that occur in any given month (see discussion below).
Anyway, a couple of months ago, I warned that previous traffic downturns had actually resulted in an increase in bird strike numbers and rates. Some clever people on LinkedIn pointed out the timing of the increase also coincided with a significant wildlife strike event, United Airlines 1549, and I did a bit more analysis before updating my post (and here I am updating again).
But general post-COVID commentary and the guidance coming out of ICAO is still identifying wildlife as a hazard worthy of special attention. ICAO notes the hazard as an:
Increased wildlife presence on/near some runways or taxiways that are seldom used or not used at all during the disruption.
So, how does the data stack up with respect to the situation we are currently experiencing. Well, at least as it was in May because it takes time to collate the required traffic data.
Updated Data Analysis
As before, I have used US data because it is easily available but I acknowledge that different countries are in different states of operations with some more open than others.
For bird strike data, I have used the FAA Wildlife Strike Database which I downloaded today. For traffic data, I used the US Bureau of Transport Statistics.
I still understand that this second dataset is not the best on to use. It would be better to have an airport based traffic database but that is beyond a simple web search. I acknowledge that the strike reports are not limited to airline strikes and that the traffic data does not include General Aviation traffic. But by being consistent, I think the resulting graphs have some indicative validity.
Wildlife Strikes
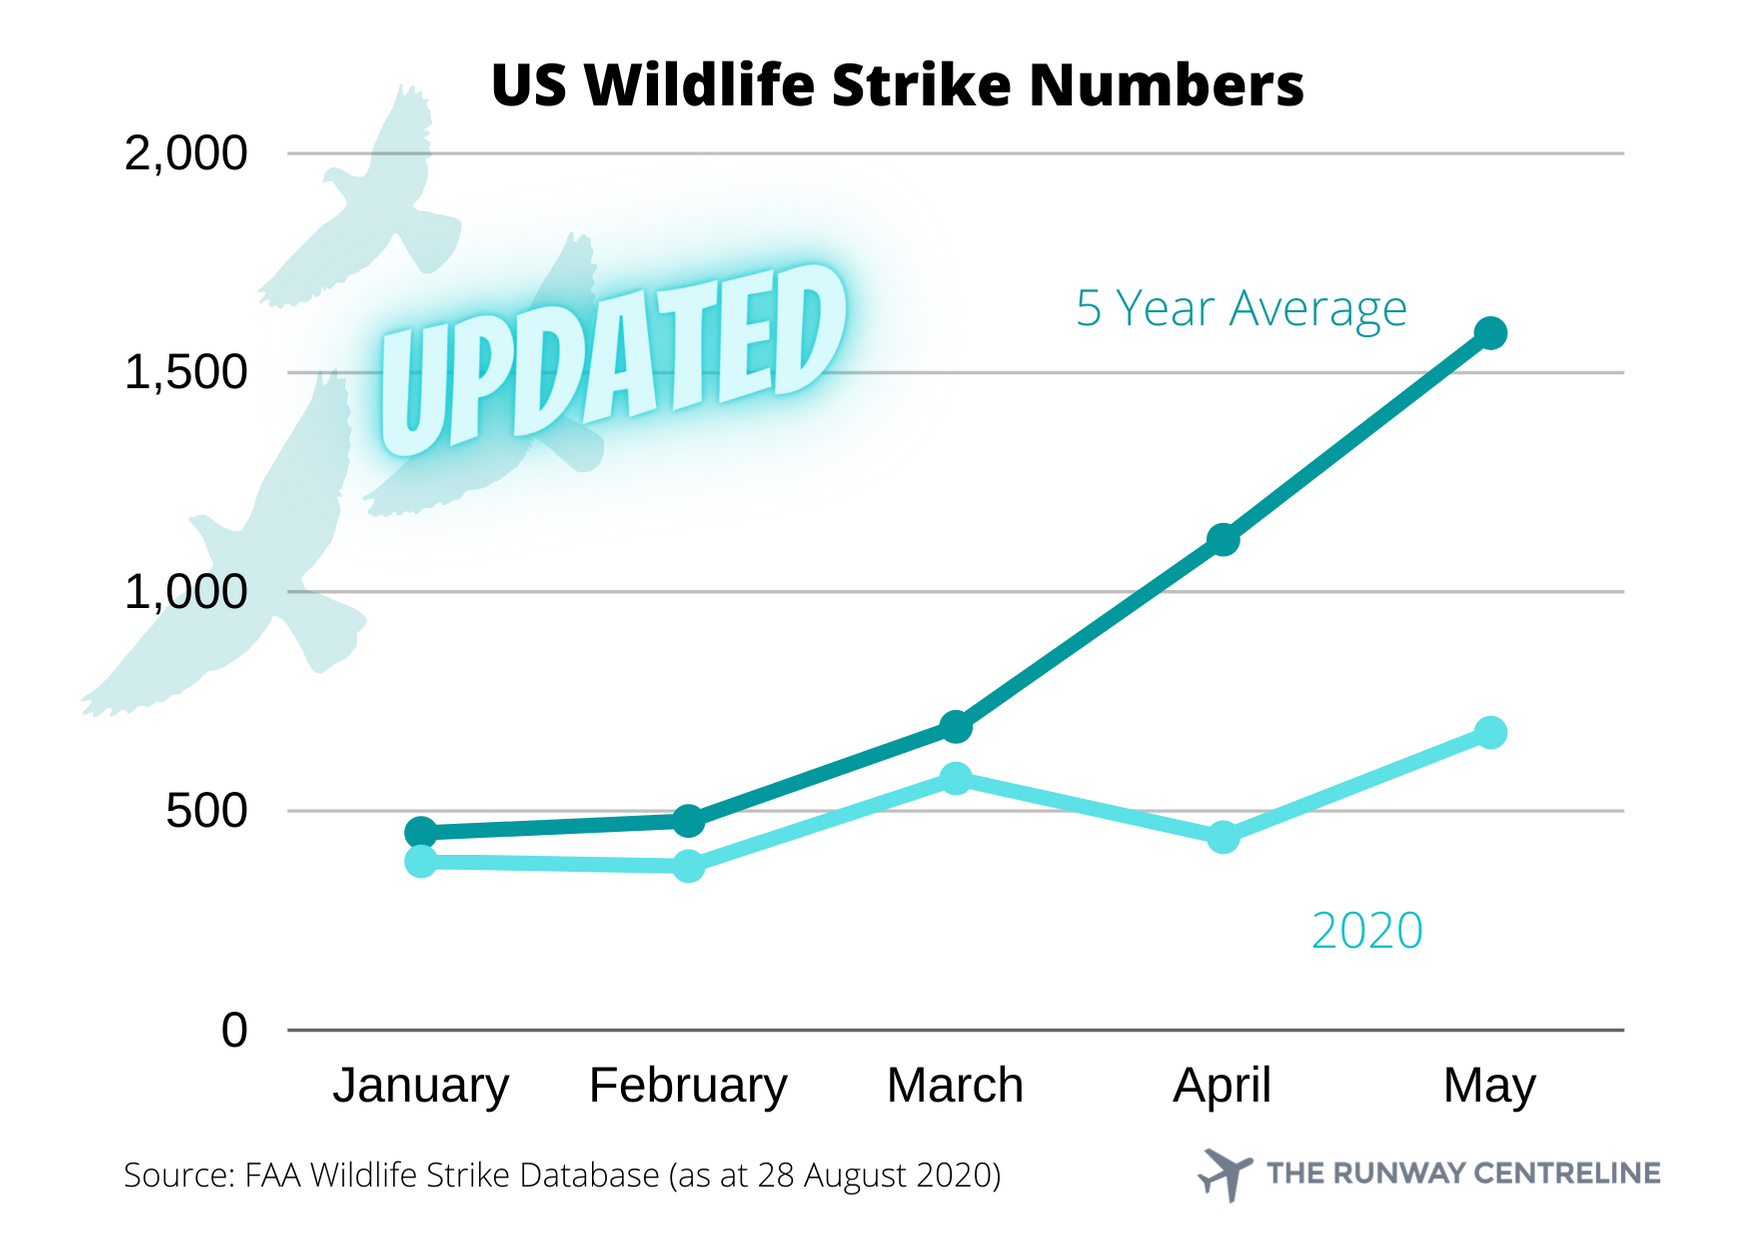
The overall message is similar to before with the 2020 number showing the expected drop compared to the 5 year average. In the more current data, there is a more pronounced uptick in the May numbers that aligns with the typical increase in strikes through the northern spring and maybe in line with a bounce back in traffic. The next chart on wildlife strike rates might tell us more.
Wildlife Strike Rates

This picture has changed significantly from the earlier analysis. And while it is still early days in terms of trend analysis, there is some upwards divergence in 2020’s strike rate.
Revised Conclusions
This revised chart starts to paint a picture of the hazard that ICAO, EASA and many other regulators have been highlighting in guidance material. Further analysis will be very interesting and I will be a little more conservative in my timeframes for producing future updates.
How Did I Stuff Up?
The short answer is that I assumed that the reporting of wildlife strikes and uploading into the database would be a relatively quick process. Given that there are mandatory reporting requirements often with time frames, I thought a month or so after the end of the target month would be enough. Obviously not.
And as I am also keen on looking at data, I analysed the time between a wildlife strike and its inclusion in the database. For 2020, it looks like this:

As you can see, my original analysis missed about a third of the reports now received for the month of May. For 2020, it has taken around 80 days for 90% of reports to be included and 115 days for 95% of reports. And there is no guarantee that we still have them all!
To take it to the next level, I looked at all the reports (currently in the database) for 2018 and found that it takes about 279 days for 90% of reports and over a year for 95% of reports (see below). I can see why academics always look at data that is over five years old!
In my eagerness to provide timely updates, I missed the fact that not all the data might be in yet. I have to send a big thank you out to Phil Shaw, who, dutifully, tried to replicate my results and found the reporting lag error. It is an important part of the safety process to share information and correct issues when they are found.
I will be back in a couple of months with the another update but this time, I’ll include some error bars!

* WARNING: PREMATURE ANALYSIS BELOW! *
I have left my original analysis here, mostly intact, to show what I initially thought and as a lesson for me in the future.
Data Analysis
I have used US data because it is widely available but I acknowledge that different countries are in different states of operations with some more open than others.
For bird strike data, I have used the FAA Wildlife Strike Database which I downloaded last month. For traffic data, I used the US Bureau of Transport Statistics.
I understand that this second dataset is not the best on to use. It would be better to have an airport based traffic database but that is beyond a simple web search. I acknowledge that the strike reports are not limited to airline strikes and that the traffic data does not include General Aviation traffic. But by being consistent, I think the resulting graphs have some indicative validity.
Wildlife Strikes

No surprise here - wildlife strikes are down on the month-to-month 5-year average.
Wildlife Strike Rates

Using traffic data to produce a comparative strike rate, we can see that there was an increased rate for April but a reduction for May, when compared to their 5-year average.
Conclusion
It is still early days, of course, but there doesn’t appear to be a significant increase in probability at this stage. We must be wary though as the probability could shift as wildlife habituation to our “quiet” airports increases or if we bounce back with relatively high increases in traffic.
I’ll check back in with another update in a couple of months.
Image credit: Azim Islam (via Pexels)